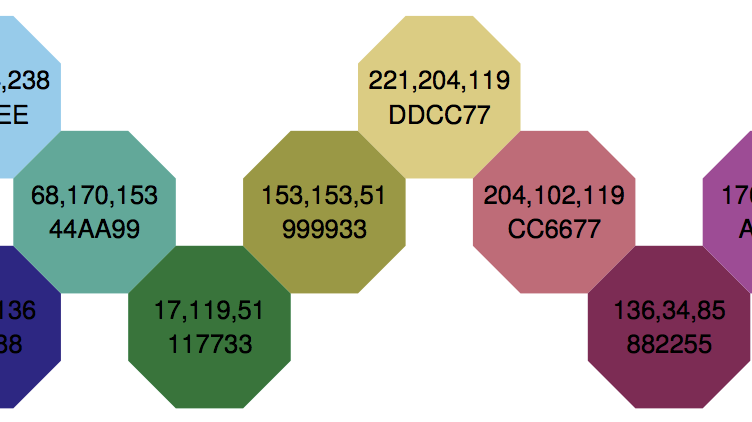
To make graphics with your scientific results as clear as possible, it is handy to have a palette of colours that are:
distinct for all people, including colour-blind readers;
distinct from black and white;
distinct on screen and paper;
still match well together.
To optimize the palette, I have used mathematical descriptions of colour differences and colour-blind vision.
