Skip to content

VISUAL DESIGN

Inspiratie voor Visuele Communicatie

  • beeld
  • kleur
  • layout
  • typografie
  • vorm
  • culture sensitive
Main Menu

Cocktail Data Visualisation with D3.js and SVG

April 14, 2019admin

https://www.andybarefoot.com/cocktails/

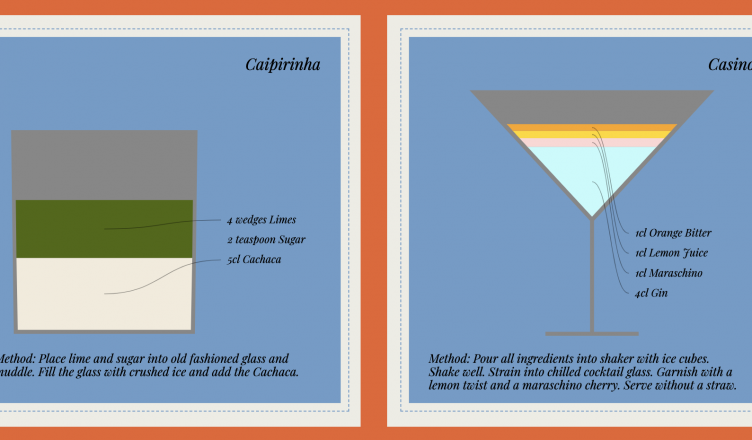
An exercise in using D3.js and SVG to create data visualisations of cocktails and their ingredients by Andy Barefoot. Based on this original visualisation by Tatjana Dubovina & David McCandless.

Posted Under
beeld
Tagged
datavisualisatie

Post navigation

Feather
Variable font designed for City in Motion

Tags

alfabet animatie boeken campagne collage compositie concept datavisualisatie design basics design system fotografie freefont freefonts gestaltwetten gratis grid icoon illustratie infographics information design kleurpalet leesbaarheid Letterkeuze letterontwerp logo moodboard oefening onderzoek ontwerper opdracht pictogram poster presentatie responsive schetsen screen design stopmotion styleguide tool tools variable font visuele identiteit webdesign webtypografie workshop
Copyright © 2025 VISUAL DESIGN.
Proudly powered by WordPress. | Theme: Awaken by ThemezHut.