Skip to content

VISUAL DESIGN

Inspiratie voor Visuele Communicatie

  • beeld
  • kleur
  • layout
  • typografie
  • vorm
  • culture sensitive
Main Menu
dataviz

Nadieh Bremer – Datavisualisation designer

Conifer Research

Font Friday

Pimp my Type

Fix Widows, Orphans and Runts

dataviz
Nadieh Bremer – Datavisualisation designer
Conifer Research

Oefening: Typografie Layout

March 27, 2018April 24, 2018admin
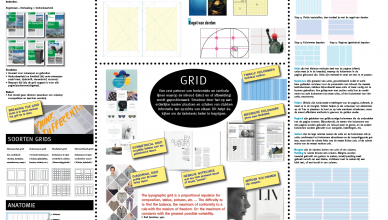
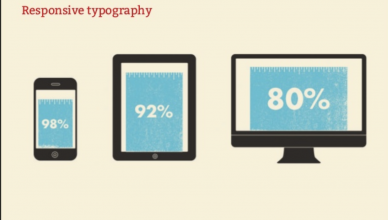
Gebruik een modular grid ↓ Templates voor Photoshop of InDesign.zip en plaats een tekst op zoveel mogelijk verschillende manieren als je kan. Maak [...]

Opdracht: Ontwikkel een Grid Systeem

March 22, 2018March 30, 2018admin
Design a grid system for a document, website, magazine or booklet (min. 3 pages). Opdracht: Ontwerp een grid systeem voor een brochure voor [...]

Opdracht: Visualiseer een dataset

March 19, 2018March 30, 2018admin
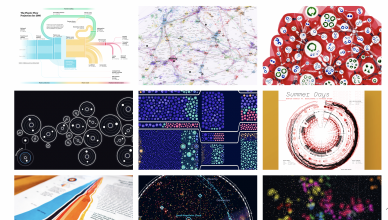
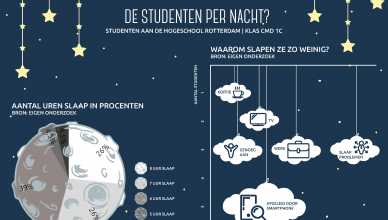
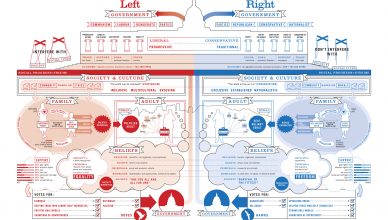
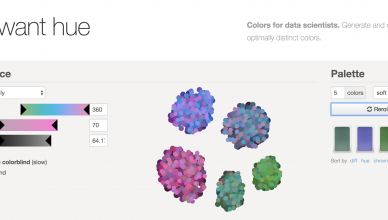
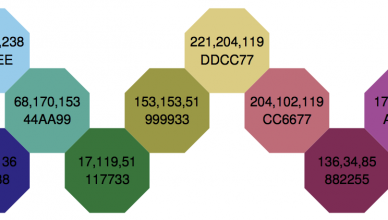
Voorbeeld boven: Rosanne van Golen, jaar 1 CMD 2018 OPDRACHTOMSCHRIJVING Ontwerp een datavisualisatie met minimaal drie componenten. Experimenteer! ↓ TIPS-Datavisualisatie.pdf ↓ Presentatie: Datavisualisatie [...]

Stefanie Posavec – datavisualisaties

March 16, 2018March 16, 2018admin
Hello! I’m a designer, and data is my favoured medium. I tend to work with data projects that involve language, literature, or science [...]

We heart it! Evoking emotion through typography

March 15, 2018March 15, 2018admin
We heart it! Evoking emotion through typography from Chiara Aliotta [...]

20 perfect font pairings

March 15, 2018March 15, 2018admin
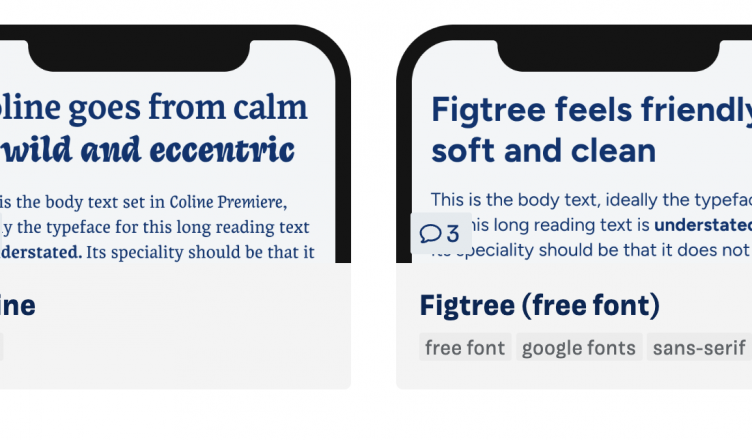
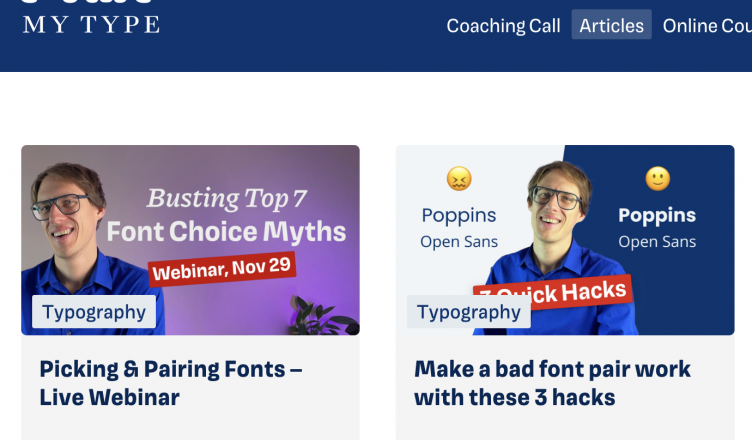
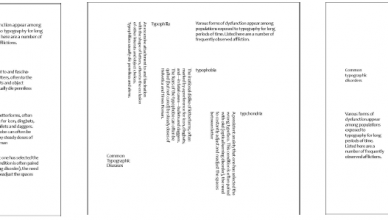
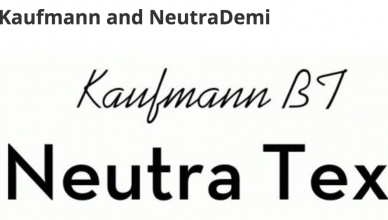
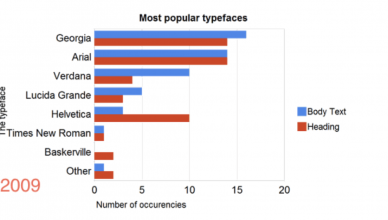
“We reveal 20 font pairings that are made for each other – some may just surprise you.” https://www.creativebloq.com/typography/20-perfect-type-pairings-3132120 Also, as you’re pairing your [...]

The Effect of Typography on User Experience & Conversions

March 15, 2018admin
[...]

Photos as Web Content

March 15, 2018admin
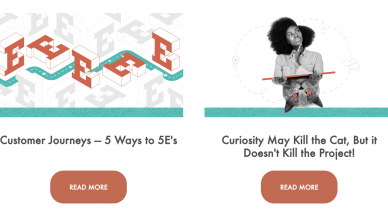
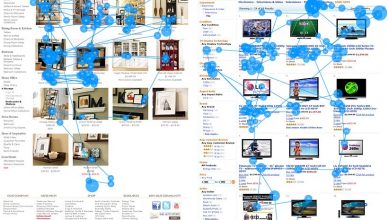
“Our eyetracking studies have documented a dramatic gap in how users approach website images: Some types of pictures are completely ignored. This is [...]

i want hue

March 14, 2018admin
Colors for data scientists. Generate and refine palettes of optimally distinct colors. http://tools.medialab.sciences-po.fr/iwanthue/ [...]

Colour Schemes (Paul Tol’s Notes)

March 14, 2018March 14, 2018admin
To make graphics with your scientific results as clear as possible, it is handy to have a palette of colours that are: distinct [...]

Posts navigation

  • Previous
  • 1
  • …
  • 48
  • 49
  • 50
  • 51
  • 52
  • 53
  • 54
  • …
  • 93
  • Next

Tags

alfabet animatie boeken campagne collage compositie concept datavisualisatie design basics design system fotografie freefont freefonts gestaltwetten gratis grid icoon illustratie infographics information design kleurpalet leesbaarheid Letterkeuze letterontwerp logo moodboard oefening onderzoek ontwerper opdracht pictogram poster presentatie responsive schetsen screen design stopmotion styleguide tool tools variable font visuele identiteit webdesign webtypografie workshop
Copyright © 2025 VISUAL DESIGN.
Proudly powered by WordPress. | Theme: Awaken by ThemezHut.